
What your team sees

See how teams follow cases, reviews, and results.

These screens show one way your team could work in a live operation.

Swipe the tabs and screen to explore all seven views.
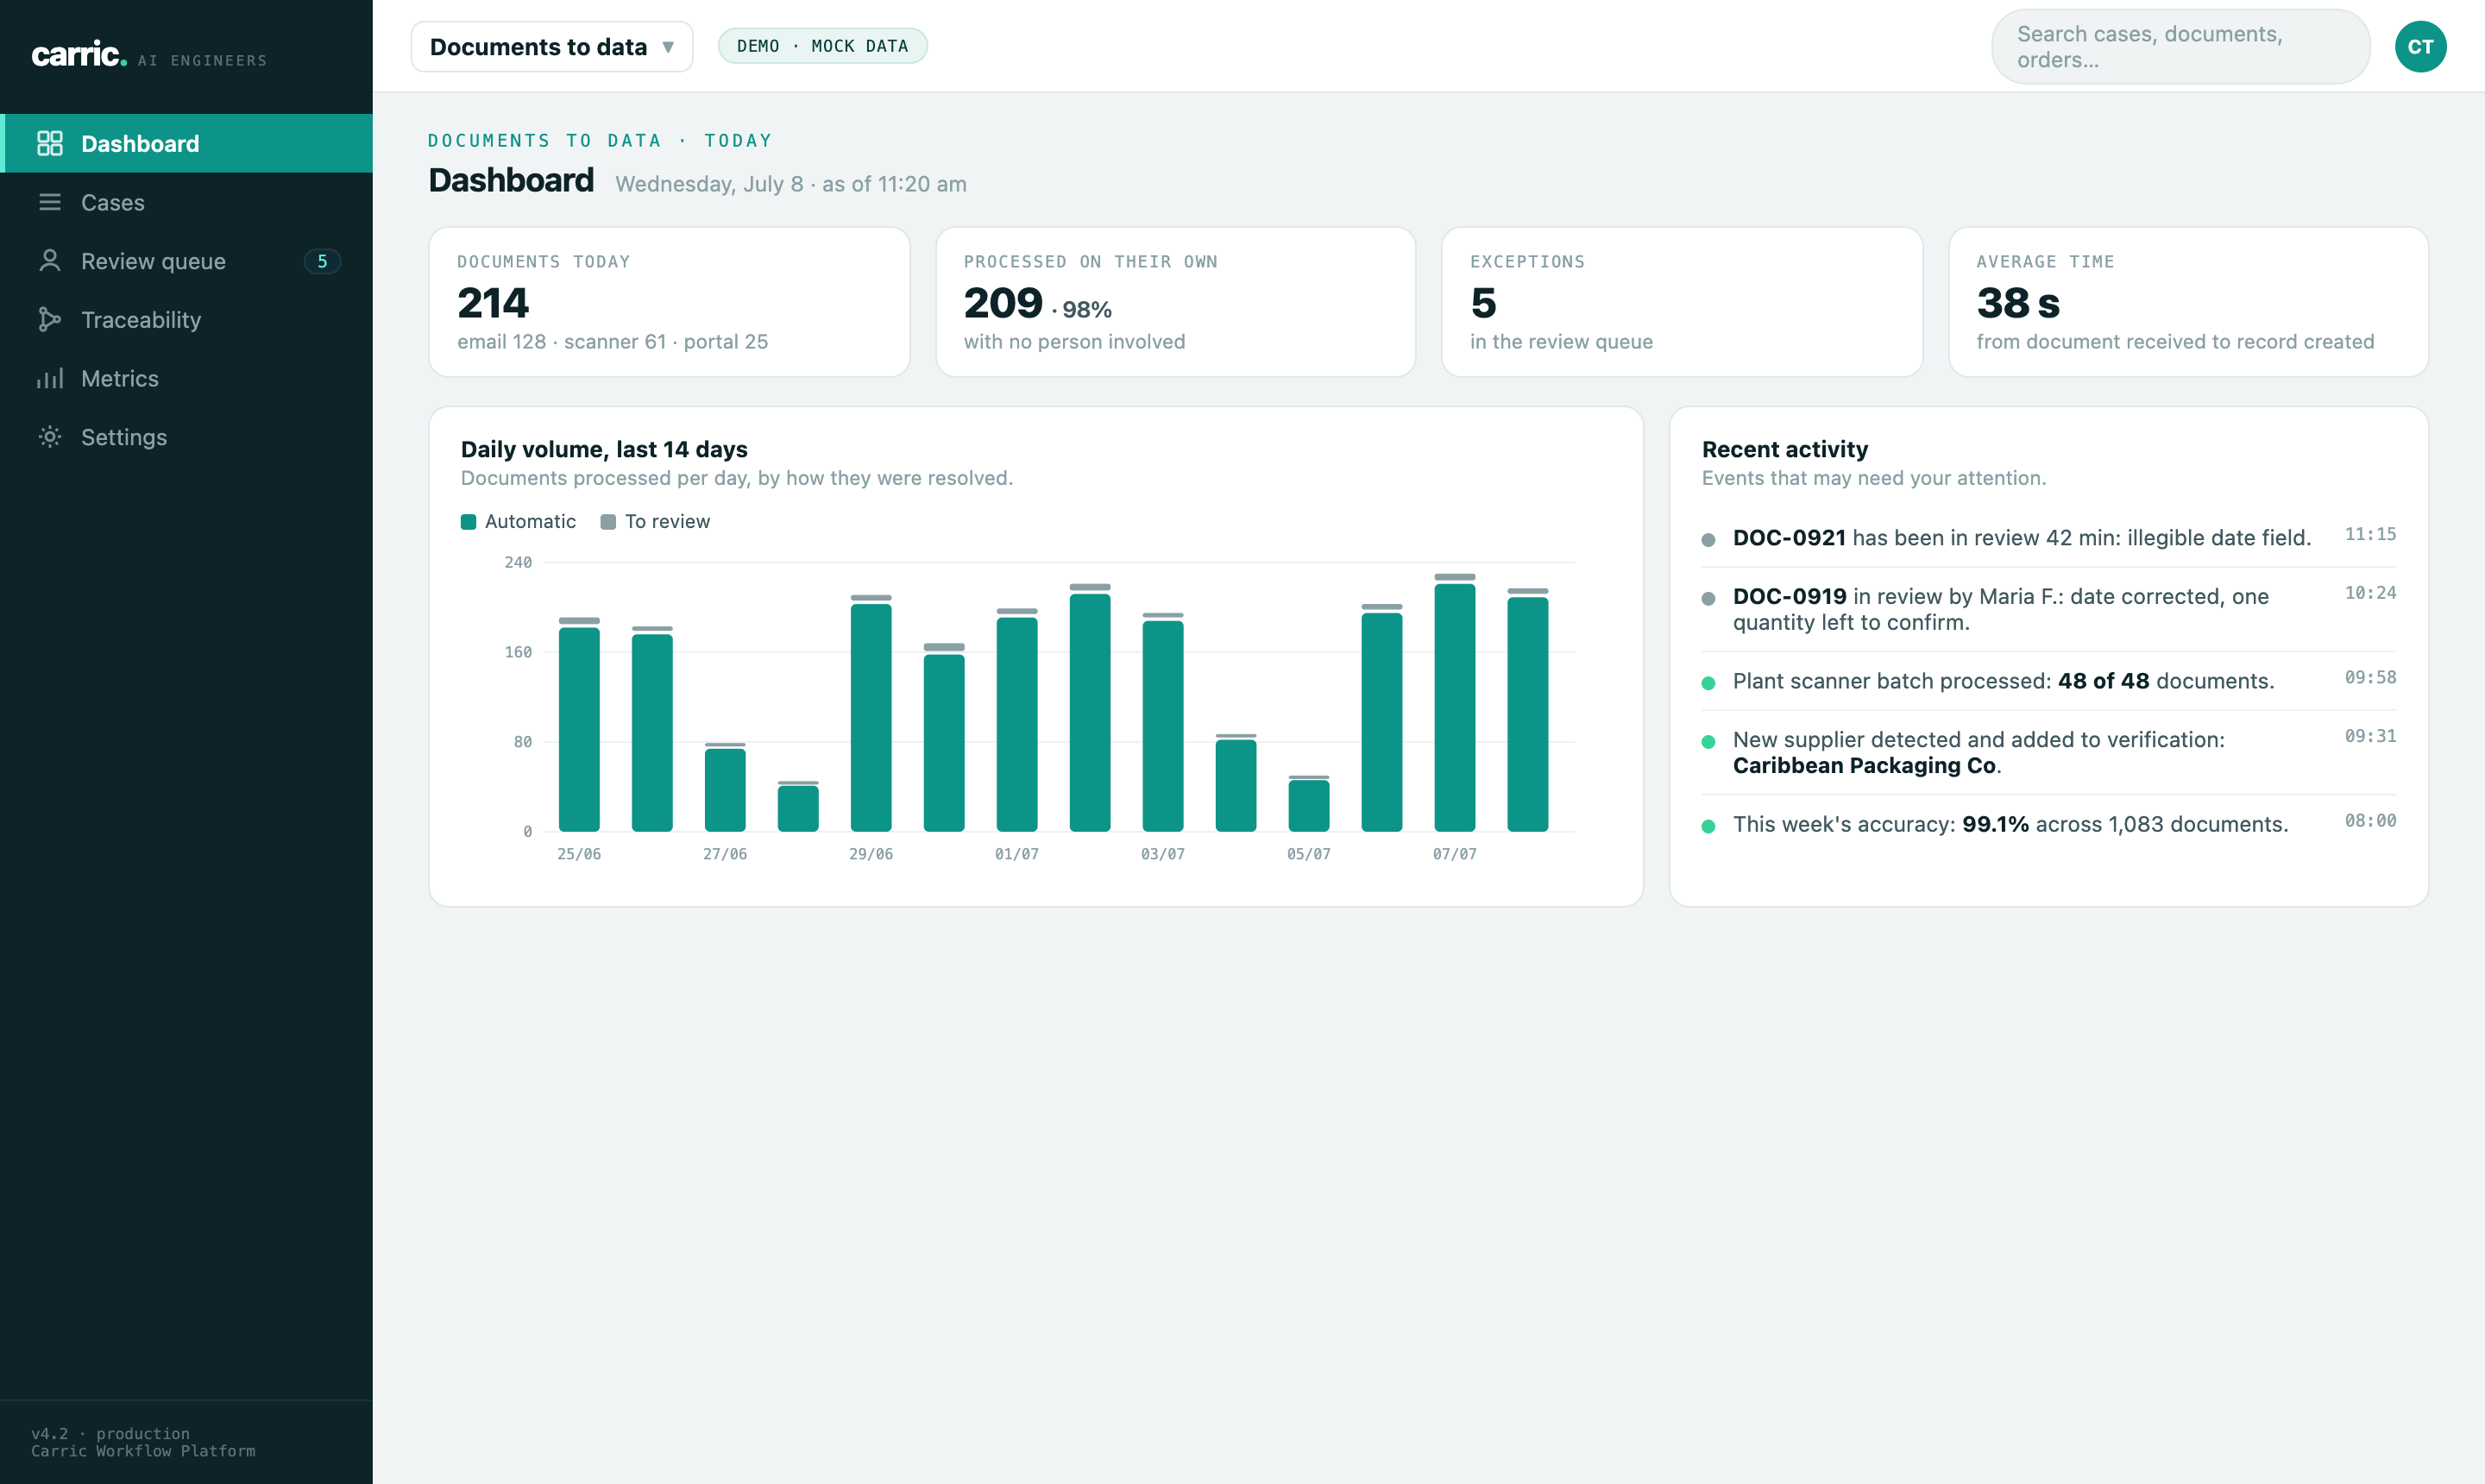
Dashboard showing mock workflow volume, automated cases, exceptions, average time, and recent activity
SCREEN 1 OF 7 Dashboard See workflow volume, exceptions, speed, and recent activity in one view. Open full image

Mock data shows how the interface works. This is not a client system or a live implementation.

Next: How it is built

See how rules, models, people, and controls work together.

See how it is built

Bring us the operation you need to improve.

Carric will help define the right starting point, owner, and next decision.

Book a 30-minute call